Overview
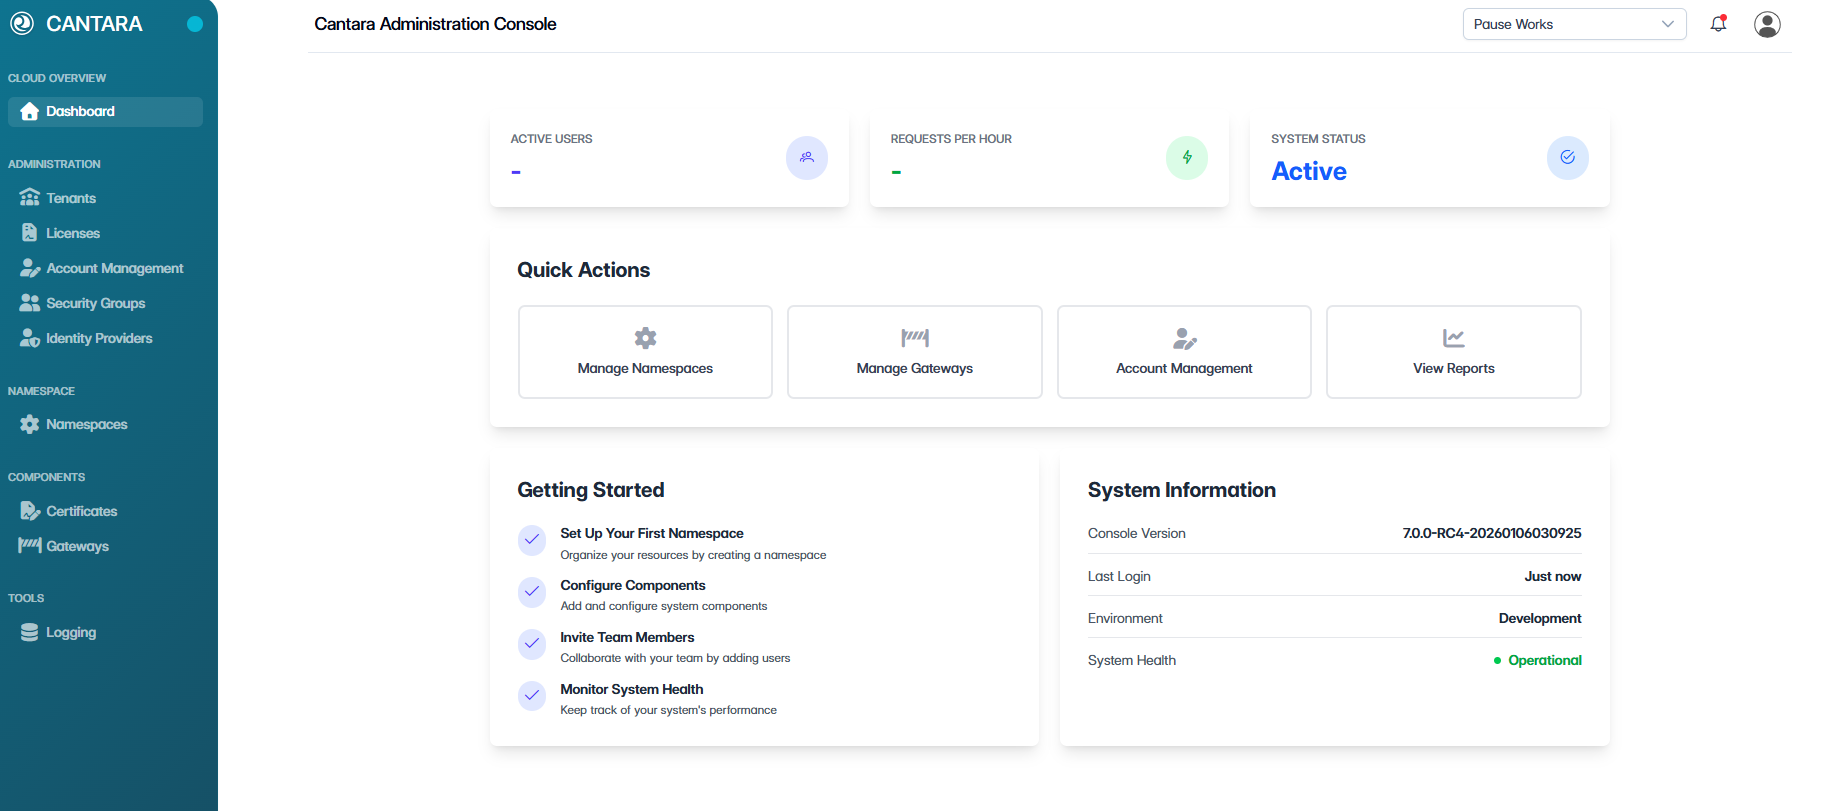
The Cantara Dashboard is the entry point to the Cantara Administration Console. It is displayed after a successful login and provides administrators with a consolidated view of system status, access to key functions, and essential environment information.
Status Bar
The status bar, located at the top of the console, is accessible from all screens and displays the current tenant and authenticated user.
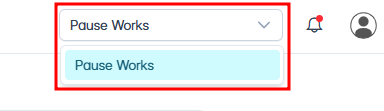
Tenant Selection
Use the tenant selector to switch between available tenants.
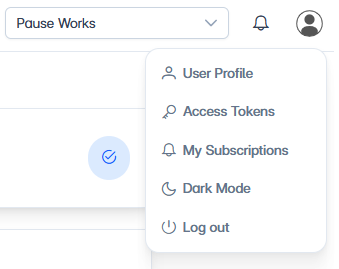
User Menu
Select the user icon to access administrative options, including:
-
Viewing the user profile
-
Managing access tokens
-
Managing subscriptions
-
Switching between Light Mode and Dark Mode
-
Logging out of the console
Navigation Panel
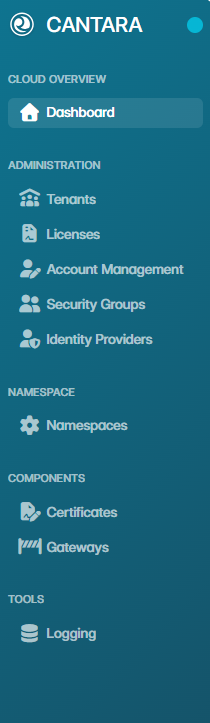
The navigation panel provides access to all Cantara administrative features. Options are organised into menu groups for efficient navigation between system components.
Key Metrics
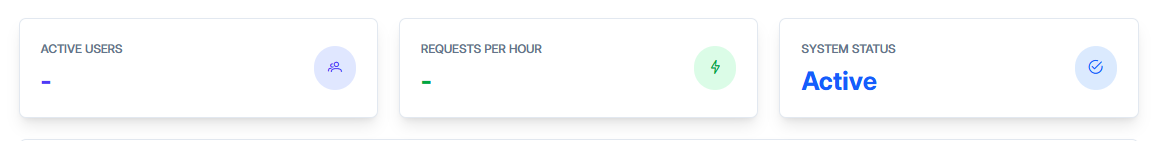
The Dashboard displays key operational metrics to support system monitoring, including:
-
Active users
-
Requests per hour
-
Overall system status
These metrics provide a high-level overview of system activity and health.
Quick Actions
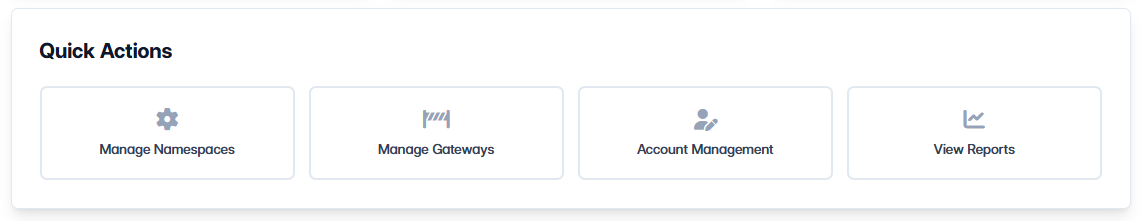
The Quick Actions section provides direct access to commonly used administrative functions, including:
-
Namespace management
-
Gateway management
-
Account management
-
Report viewing (Currently under development and not yet available)
Recent Support Tickets
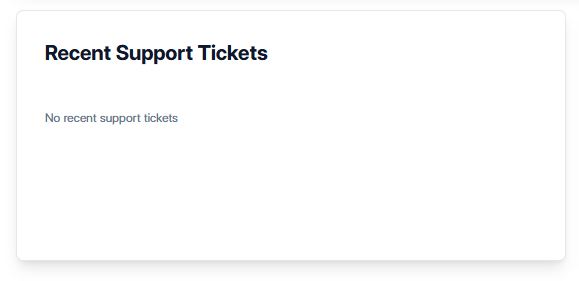
The Recent Support Tickets section is currently in development. When available, this section will display recent support ticket activity to help administrators review and monitor support requests.
-
Recent support tickets
-
Ticket status and priority
System Information
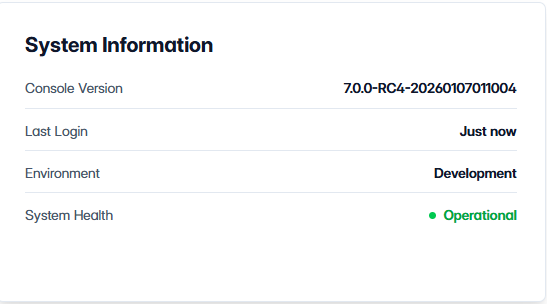
The System Information section includes system-level information relevant to administrators, such as:
-
Console version
-
Last login details
-
Environment type
-
Overall system health