A Gantt chart is a visual that is used to illustrate scheduled. The Gantt chart feature in the Cantara Integration Platform allows you to obtain a visual of scheduled groups.
The Gantt chart for a scheduled group includes the following:
-
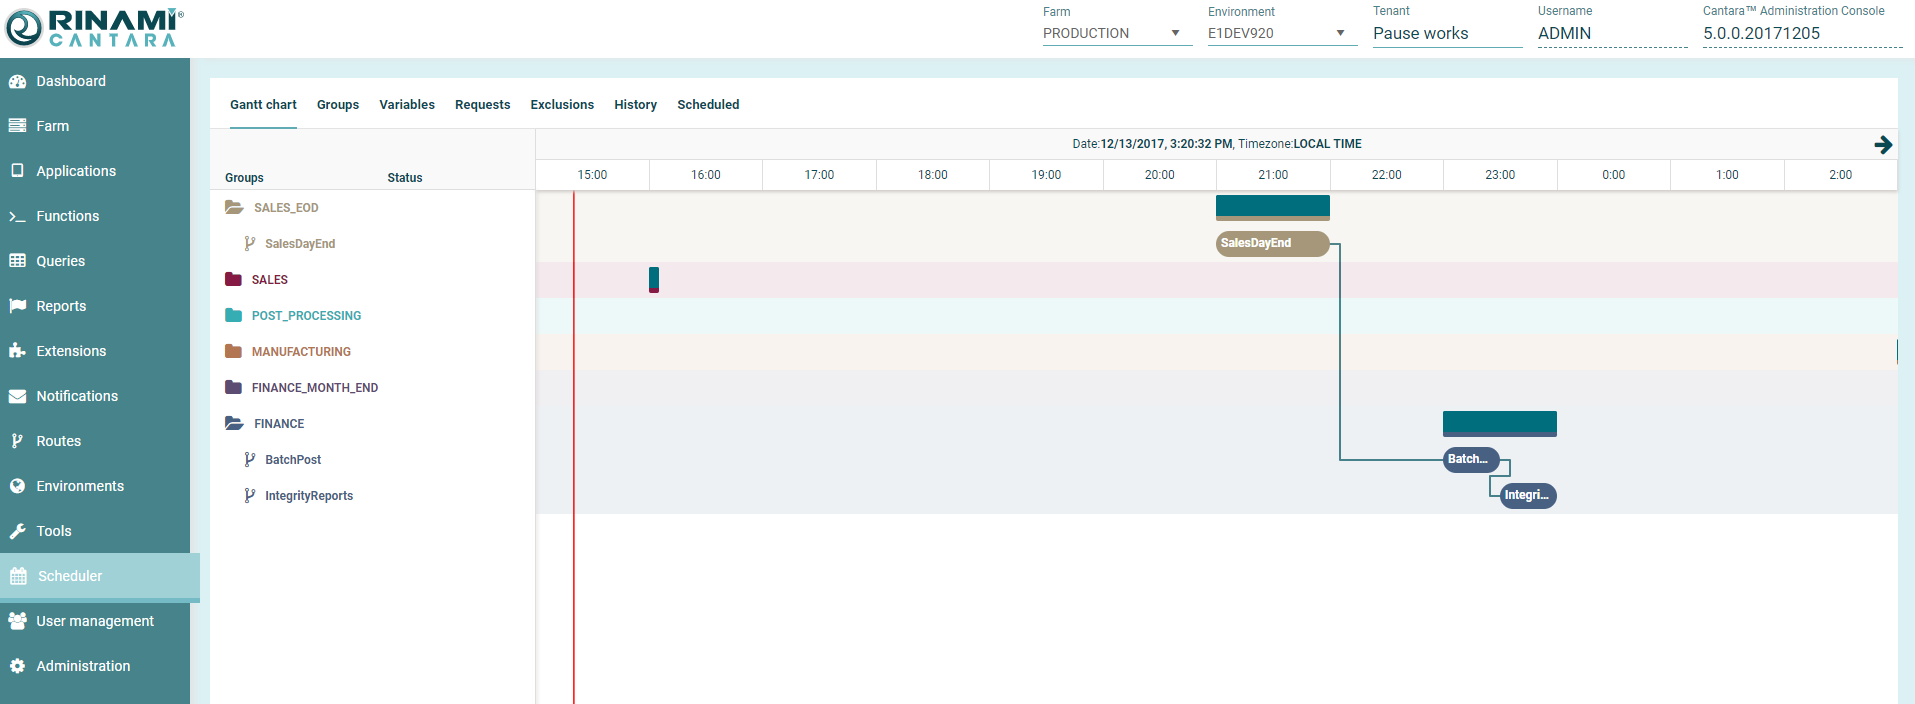
List of dependencies between groups
-
Next scheduled job to run
-
Running jobs
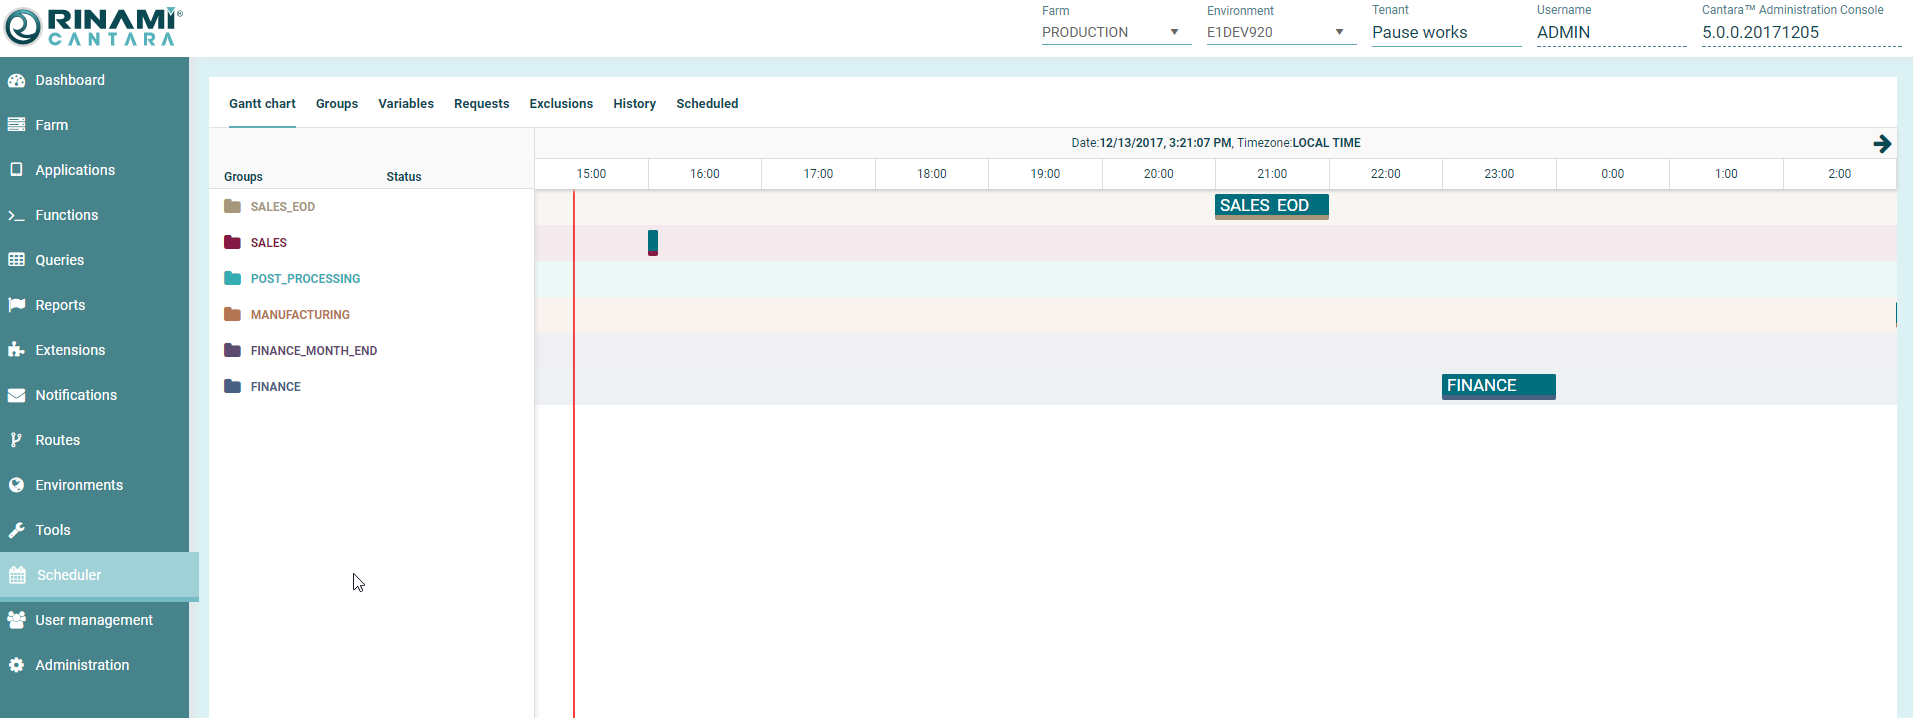
To view the Gantt chart for a scheduled group
-
Select Scheduler in the navigation panel.
-
Select the Gantt node.
-
You can collapse and expand Streams as required to assist with reviewing the schedule.
To expand the Gantt, click on the Stream name, dependencies are only visible when the streams are expanded.