A Gantt chart is a visual that is used to illustrate scheduled. The Gantt chart feature in the Cantara Integration Platform allows you to obtain a visual of scheduled groups.
The Gantt chart for a scheduled group includes the following:
-
List of dependencies between groups
-
Next scheduled job to run
-
Running jobs
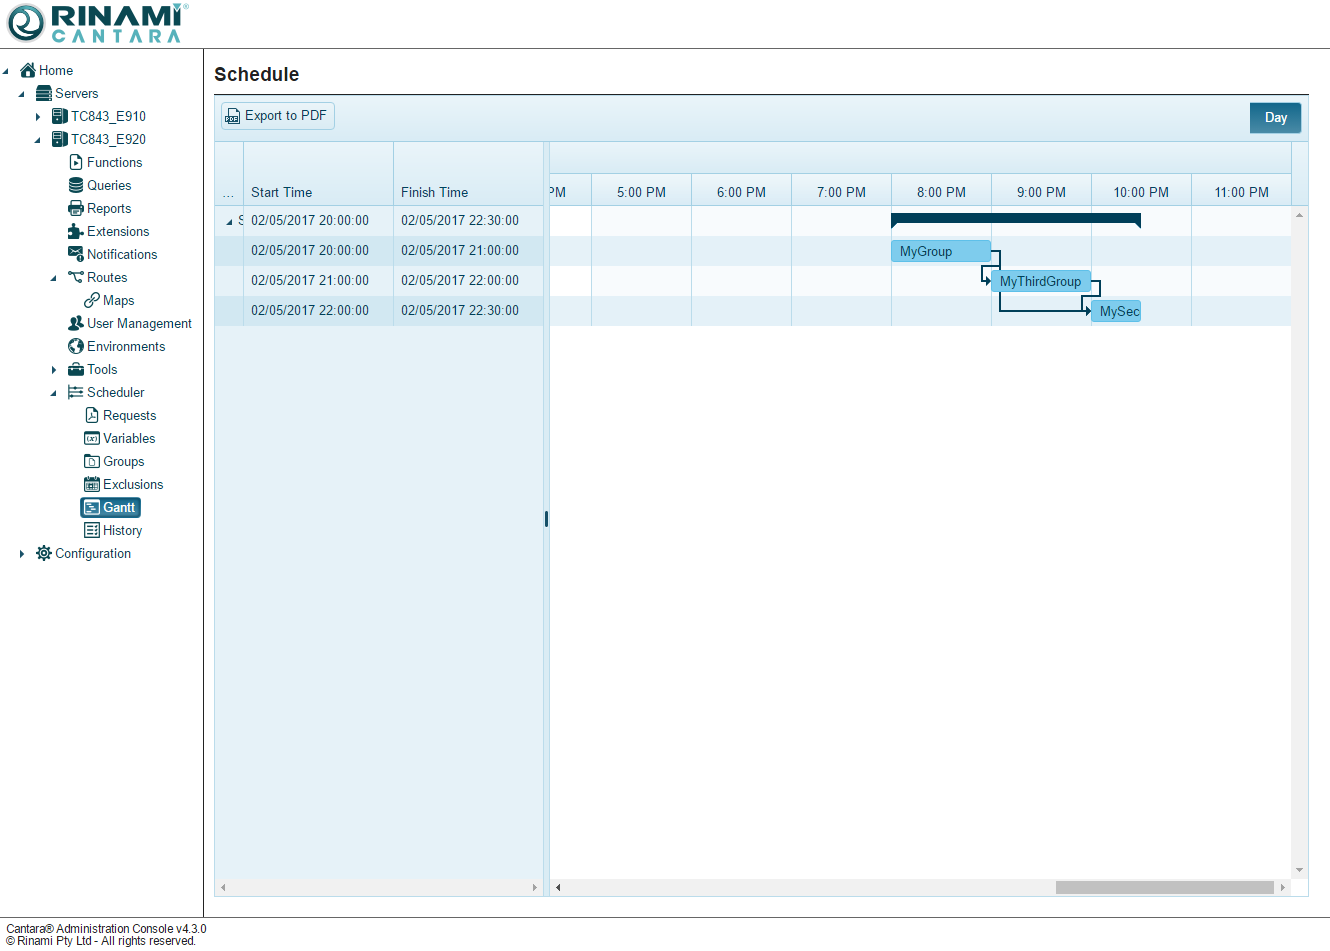
To view the Gantt chart for a scheduled group
-
Select Scheduler in the navigation panel.
-
Select the Gantt node.
-
You can collapse and expand Streams as required to assist with reviewing the schedule.