Viewing the Scheduler Gantt Chart
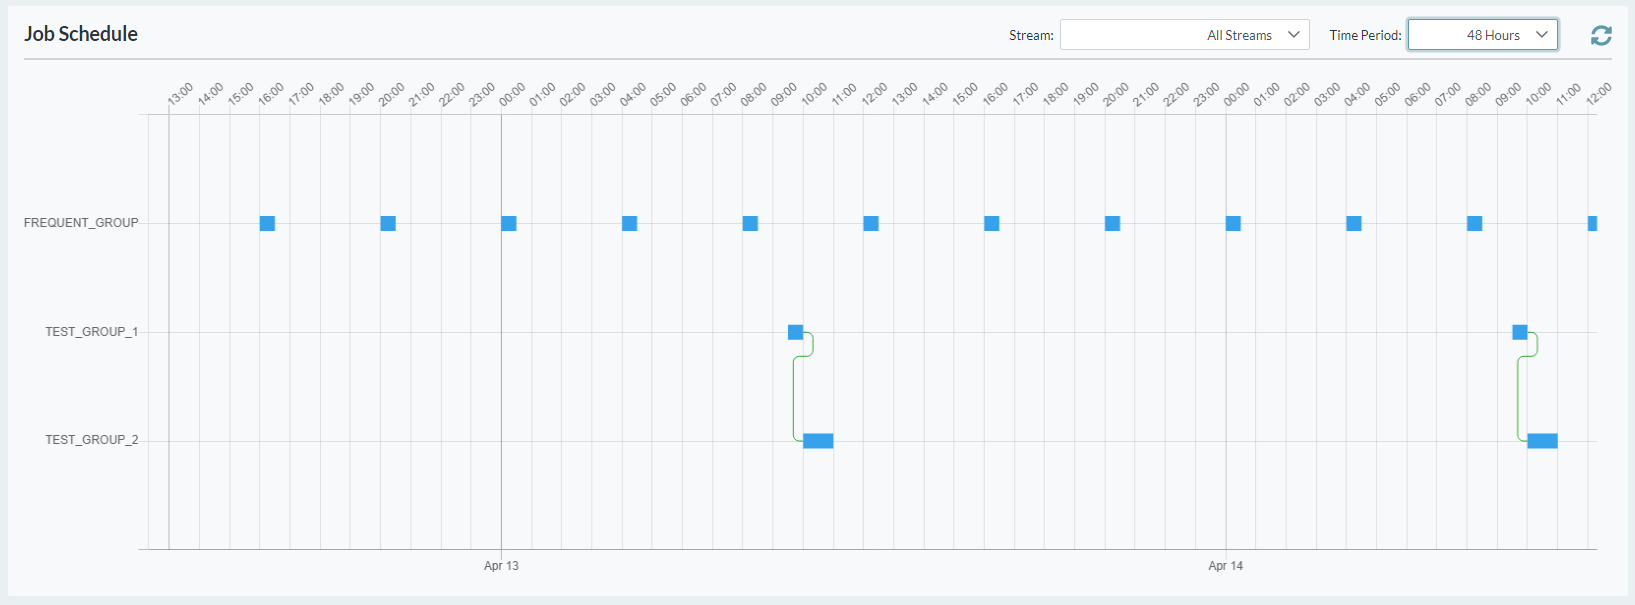
The Gantt Chart screen provides a visual representation of scheduled groups and dependencies.
It also highlights the currently running jobs, and the next jobs that are scheduled to be run.
To view the Gantt chart
- Open the Scheduler menu group in the navigation panel.
- Select the Gantt node.
The Job Schedule is displayed, showing group start times, dependencies and expected durations. - Select a particular Stream to be displayed, or show all streams.
- Select a Time Period to be displayed, ranging from 4 hours to 30 days.
- Select a scheduled group to view its details.