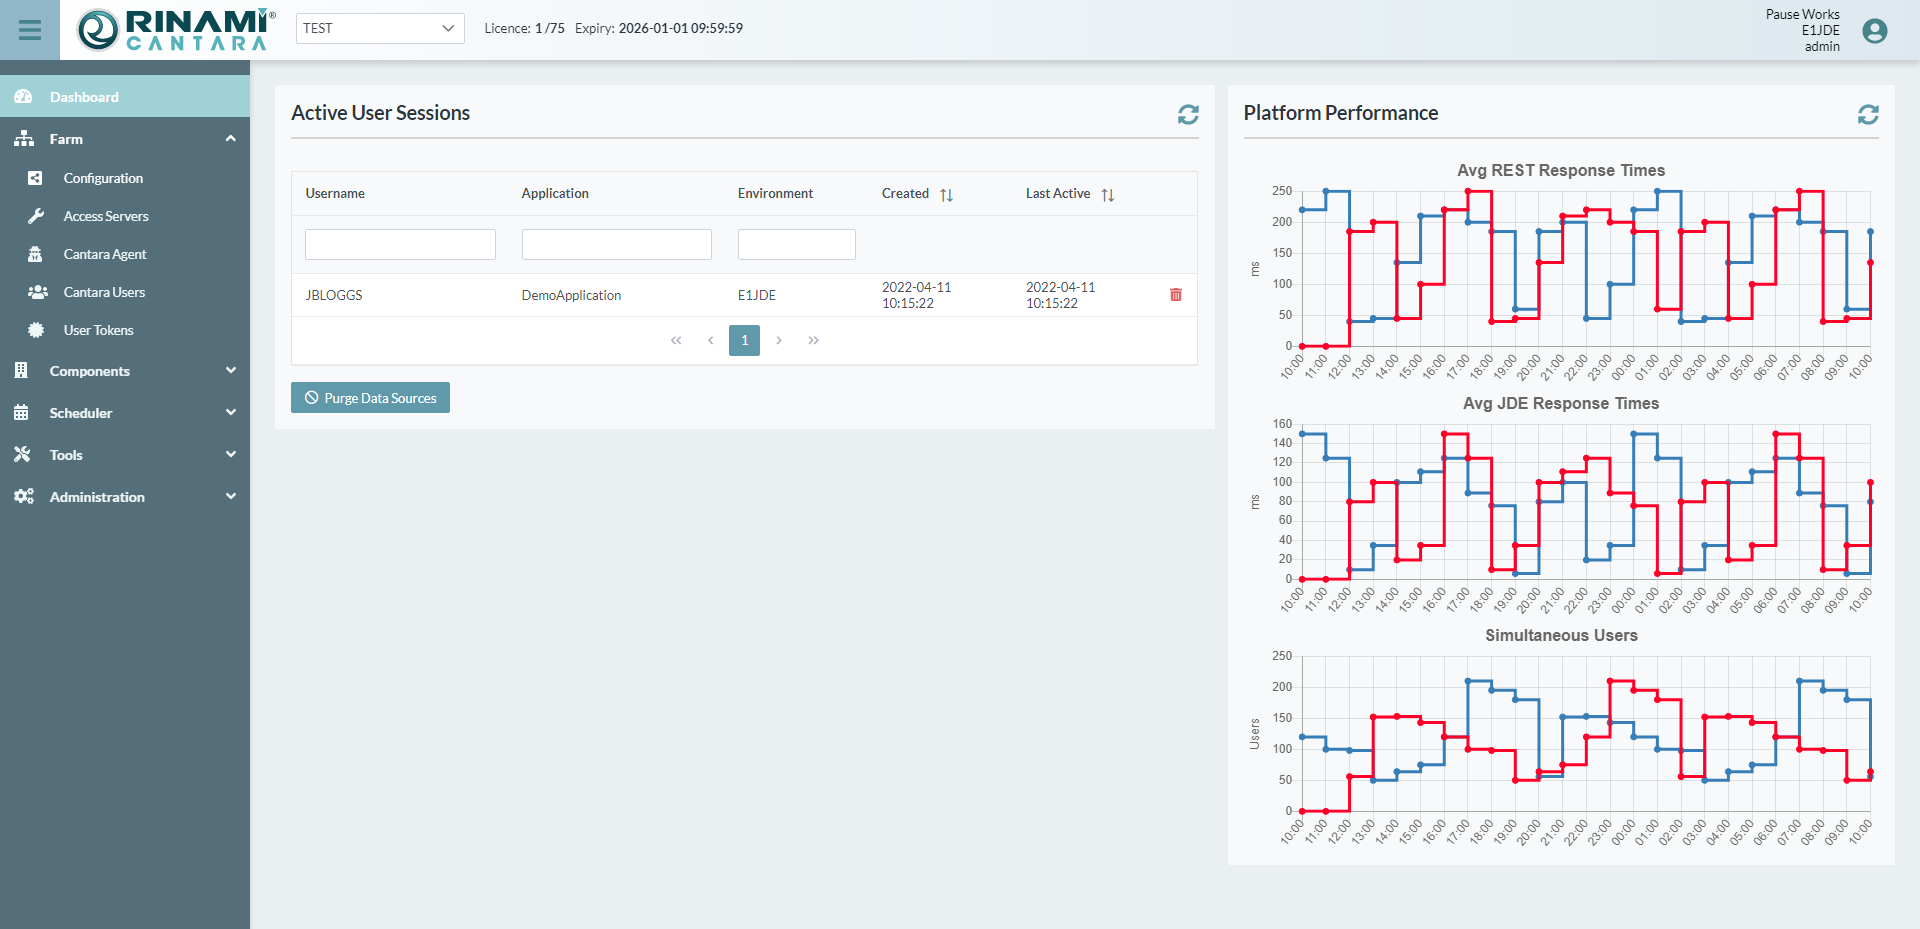
Cantara Dashboard
The Cantara Dashboard is the entry point to the Cantara Administration Console.
Status Bar and Navigation Panel
At the top of the Dashboard is a status bar, which remains available on all console screens. It contains the main menu button on the left, which opens the navigation panel. The status bar also displays the current farm, license, environment and user.

The navigation panel contains menu groups that provide access to all Cantara features.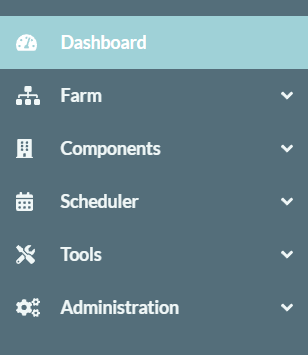
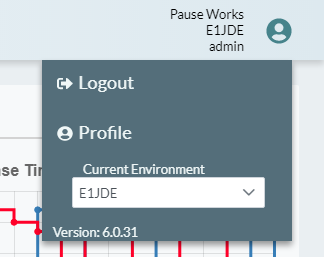
Select the User icon in the status bar to change environments, logout, or access the profile information for the current administration console user.
Active User Sessions
The first pane on the Dashboard lists all Cantara User Sessions. This includes console, scheduler and mobile app sessions.
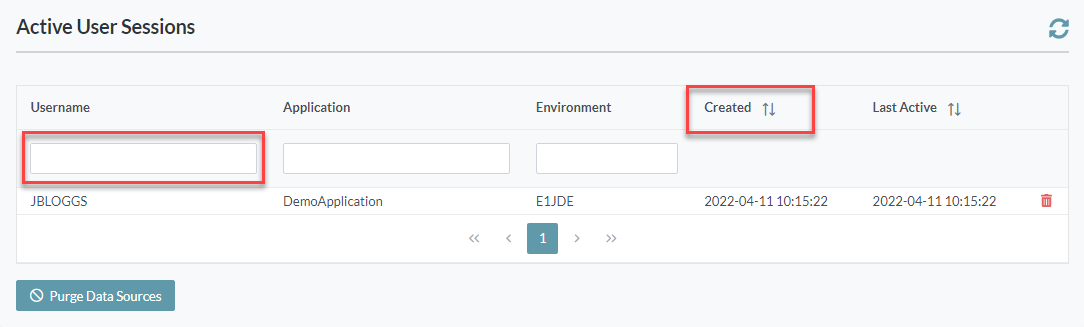
By entering text into the search fields of the first row, the session list can be filtered by Username, Application and Environment. Entries can also be sorted according to the session creation time or the last active time.
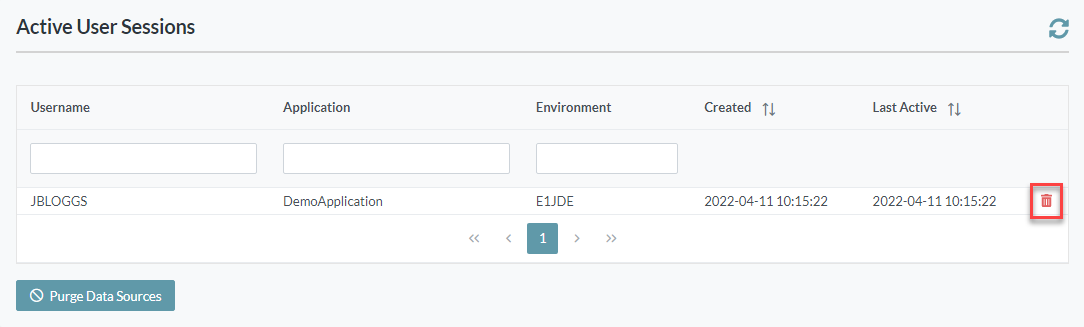
Terminate Session
An individual User Session can be terminated by clicking the Delete button at the end of its row.
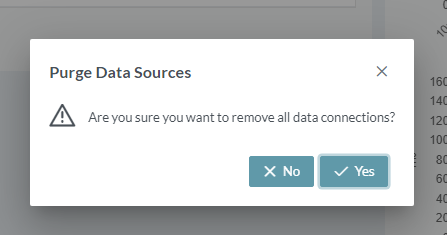
Purge Data Sources
At the bottom of the Active User Sessions pane is a Purge Data Sources button, which terminates all sessions.
The Purge Data Sources button closes all active connections to the JDE database, for all users.
To proceed with a Purge Data Sources operation, confirmation is required.
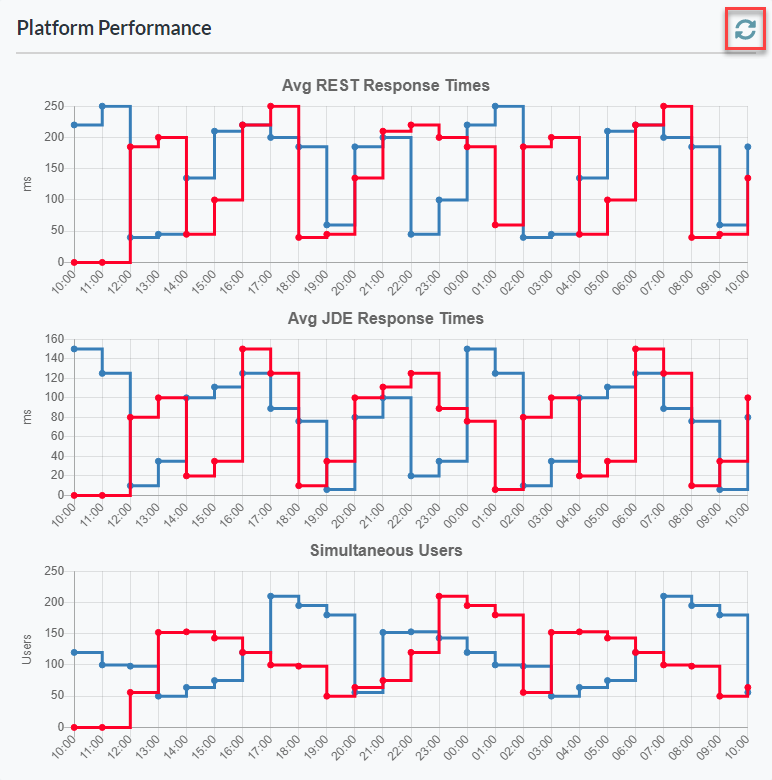
Platform Performance
The second pane on the Dashboard displays performance data by application for the last 24 hours, including average response times for both REST and JDE server transactions. You can also check how many users have been active on the system.
Hover over a graph point to see the application name. To update the display, click the refresh button in the upper right corner of the pane.